

Introduction
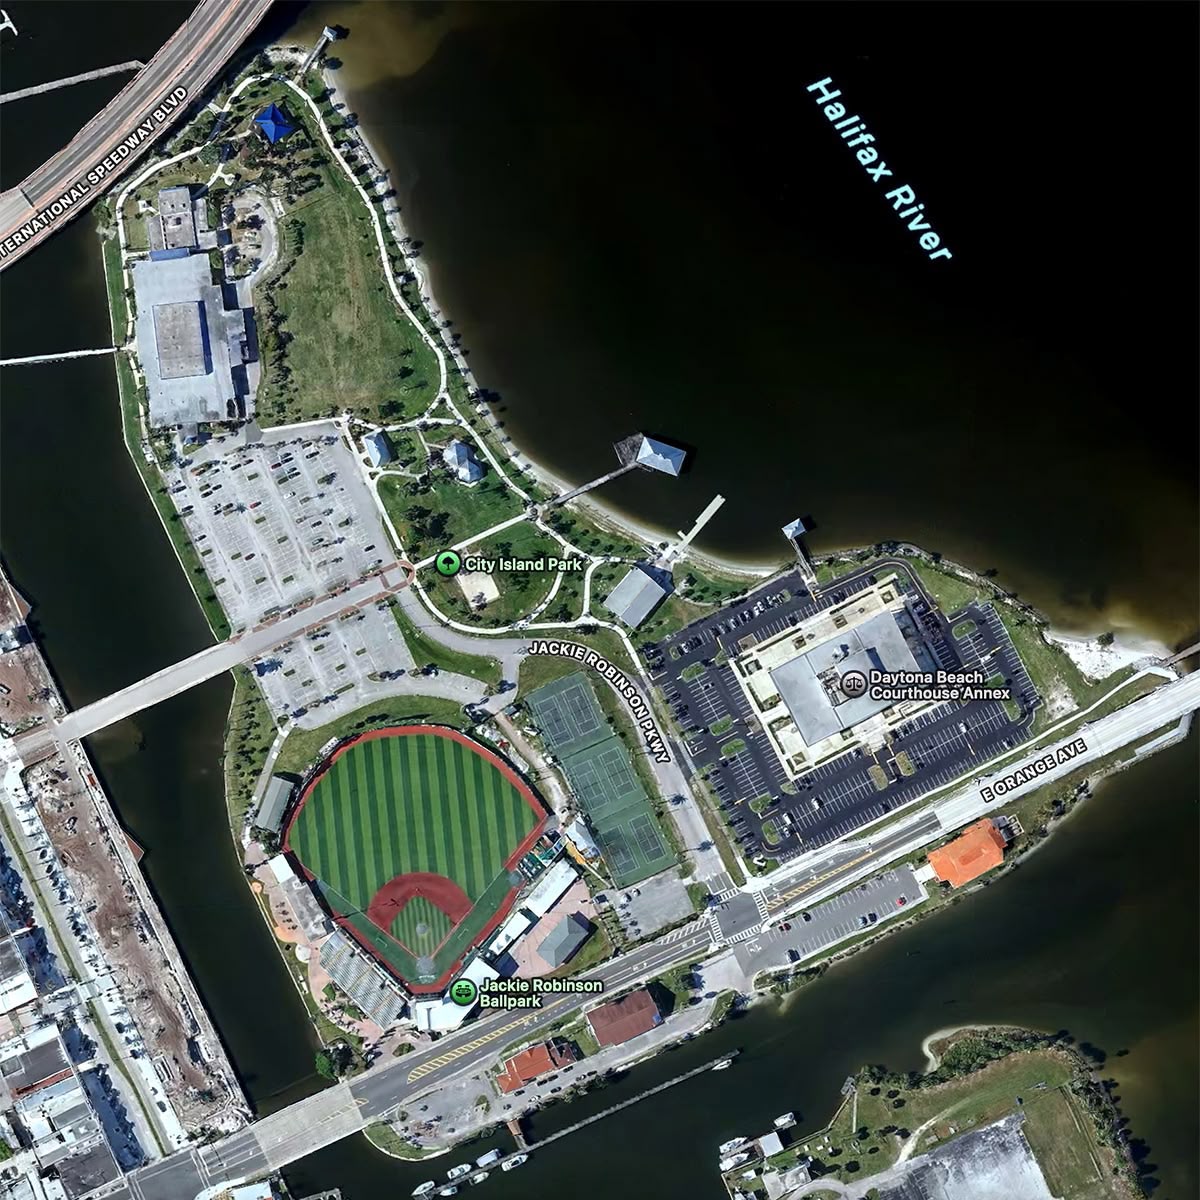
The Jackie Robinson Bllpark area is a vibrant recreational zone that regularly hosts large-scale city and sporting events. A comprehensive infrastructure project was launched in the area immediately adjacent to the local stadium.
The main objectives of this phase included:
- Large-scale improvement of the park and stadium grounds;
- Major repairs and expansion of the adjacent road network and access roads;
- Site preparation for new infrastructure and recreation areas.
The renovation is intended to increase the area’s capacity and improve resident comfort. However, carrying out the work in a densely populated area and the regular mass events near the stadium required strict discipline and meticulous planning.
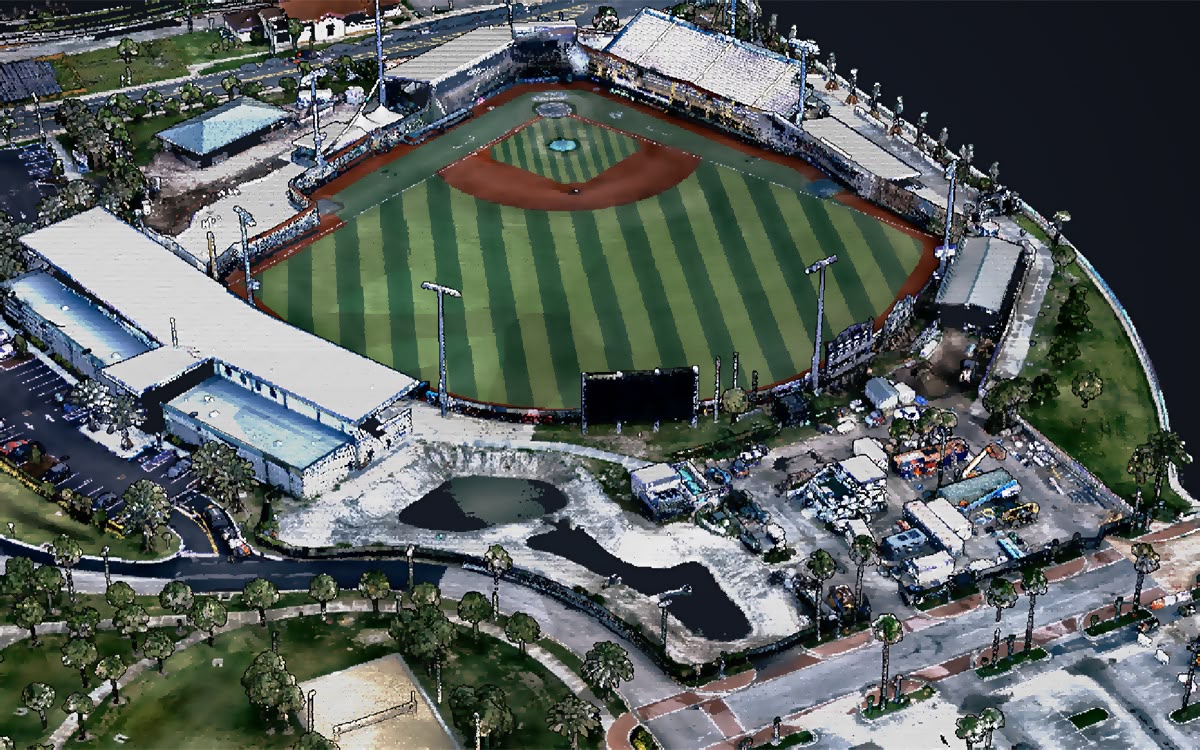
The main challenge arose during the groundwork and excavation phase. The project involved extensive terrain modifications: excavation pits, the creation of temporary and permanent embankments, site leveling, and backfilling, see Figure 1.
During site management, the team encountered the following key challenges:
- Slow speed and imprecision in volume estimation: Traditional methods of geodetic surveying and manual measurement of excavations and embankments could not keep up with the pace of equipment. Data on actual soil moved quickly became outdated, complicating operational accounting.
- Risks of financial discrepancies: The lack of an accurate, daily picture of earthwork volumes created disputes with contractors when recording completed work and calculating estimates.
- Complex logistics in a confined area: Errors in volume estimation resulted in problems: equipment jams on the narrow approaches to the stadium due to excess material being delivered, or, conversely, excavator downtime due to delays in soil removal.
- Difficulty monitoring design elevations: Manually monitoring slopes and elevations over a vast area with dynamically changing terrain increased the risk of errors when preparing the base for a new road surface.
Solution
To overcome systematic delays and eliminate calculation errors, project management decided to integrate high-precision LiDAR scanners (laser scanning). This technology enabled the rapid collection of millions of spatial points (point clouds) and the creation of a comprehensive 3D model of the construction site in minutes.
The survey was completed using the Teledyne EchoONE LiDAR which is powered by Inertial Labs RESEPI mounted on a WISPR SkyScout 2+ UAV.
The integrated LiDAR, GNSS, and IMU solution acquired a dense, accurately georeferenced point cloud covering the entire park in a single flight.
Mission Parameters
- The survey area covered a 1.7-hectare (4.25-acre) construction site.
- It took about an hour to prepare for the mission, after which the drone remained in the air for 7.5 minutes, collecting data. Processing the point cloud in the PCMasterPro software took about 10 minutes (depending on the computer’s processing power) + 10 minutes to generate the Digital Surface Model (DSM) and Digital Terrain Model (DTM): (depends on the desired resolution and other settings).
- The flight speed was about 5 m/s at an altitude of 50 meters (AGL).
- Equipment: RESEPI EchoONE LiDAR System, WISPR SkyScout 2+ Drone, WISPR SkyBoss smart controller, Emlid Reach RS4 Base Station, PCMasterPro software for data processing, and QGIS for DSM/DTM analysis.
Results
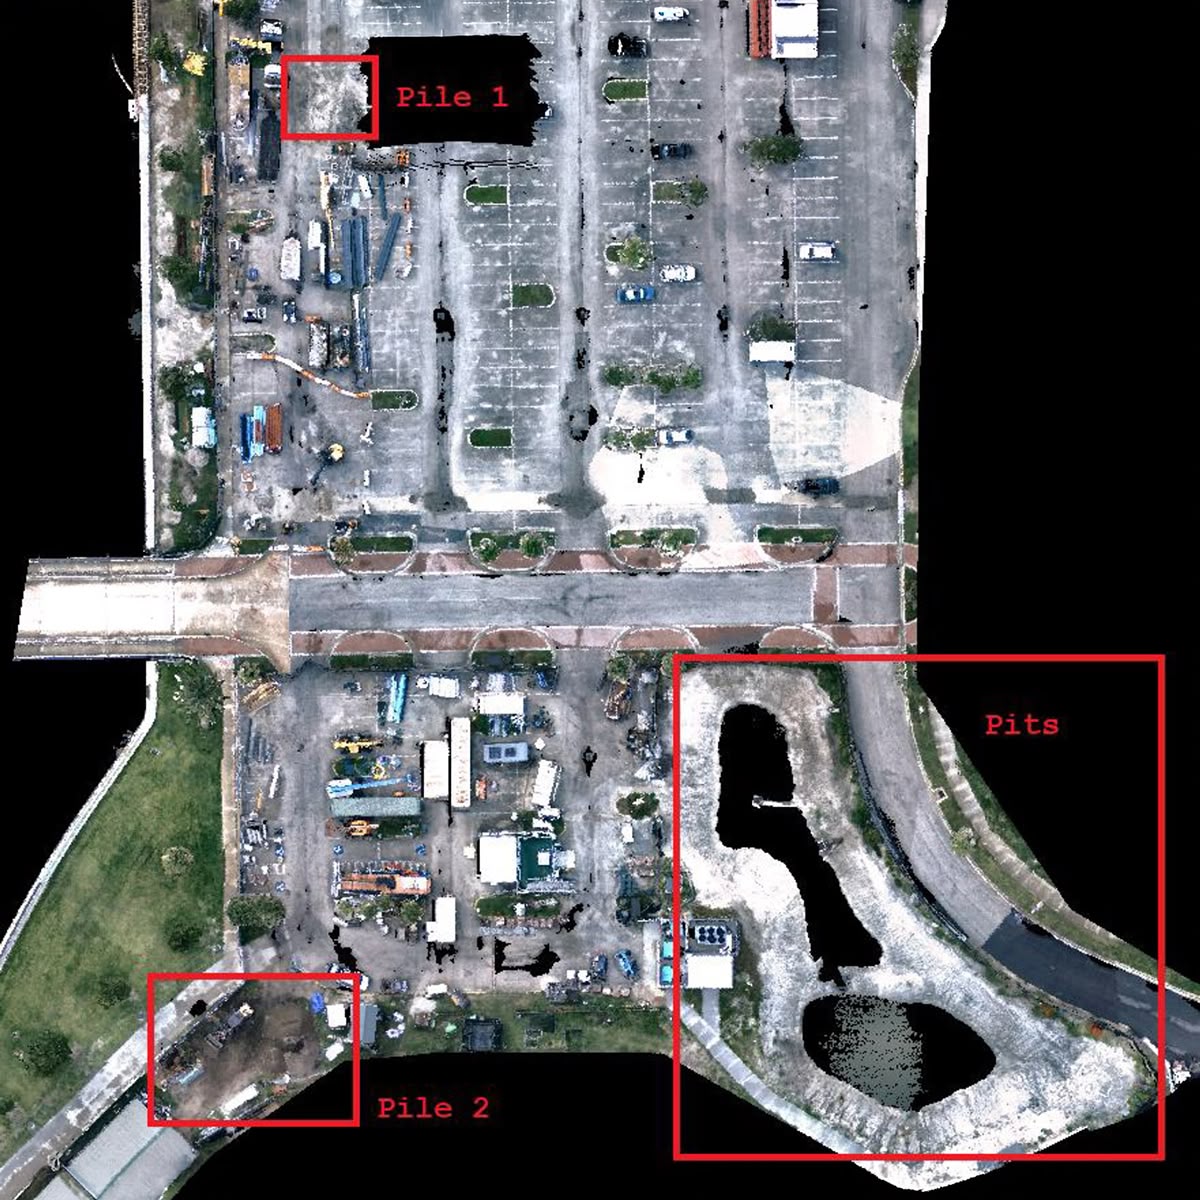
Following data acquisition, the collected LiDAR data were processed using the PCMasterPro software. The main task was to determine the volumes of the two piles and pits shown in Figure 2. Before generating DTM and DSM, an important step is to check the precision of the resulting point cloud.
To do this, we used the Median Noise (1-σ) metric, whose value reflects the noise level. A low noise level ensures a more accurate determination of object geometry. Median Noise describes the random dispersion of measurements relative to the true surface position and is defined as the median value of the standard deviation (1σ) calculated for a set of local flat areas. In other words, this metric shows how “thick” a perfectly flat surface in a point cloud becomes due to random measurement errors. Unlike the mean error, using the median makes the estimate robust to outliers arising from sensor noise, multipath propagation, or surface reflectivity. The calculation results are shown in Figure 3 where the nadir floor was also statistically computed across the dataset.
Mission planning was optimized to ensure complete coverage of the coastal corridor with sufficient overlap between adjacent flight lines. The selected flight parameters provided a dense and uniform point cloud capable of accurately representing beach topography, dune morphology, coastal vegetation, and surrounding infrastructure.
| Median Noise (1- σ) | Nadir Floor |
|---|---|
|
1.06 cm |
0.52 cm |
Figure 3. Results of noise calculation using Median Noise (1-σ) metric.
The maximum calculated noise value (3.08 cm) indicates the presence of isolated areas with degraded measurement conditions, which is typical for the edges of the scan strip and surfaces with unfavorable reflectivity.
Median Noise (1.06 cm): Fits within high-to-medium survey-grade standards, like ASPRS. Very typical for high-end UAV LiDAR at standard flight altitudes (~50-100 m).
We also verified these values using cloud cross-section shown in Figure 4. We also calculated cloud density, which is important for DSM/DTM quality.
- The point cloud density is at least 500 points per square meter.
- Precision in the profile is less than 1 cm; see Figure 4.
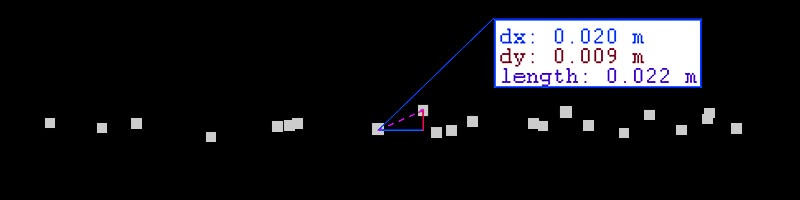
As can be seen from the cross-section of the points is less than 1 cm, which indicates the low noise level of RESEPI EchoONE.
To calculate the volumes of piles and pits, we generated DSM and DTM with the following resolution:
- The surface model resolution was set to 5 cm.
- The terrain model resolution was set to 5 cm.
As a result, we obtained DSM and DTM data, which were used to calculate the volumes of piles and pits; see Figure 5, and Figure 6.
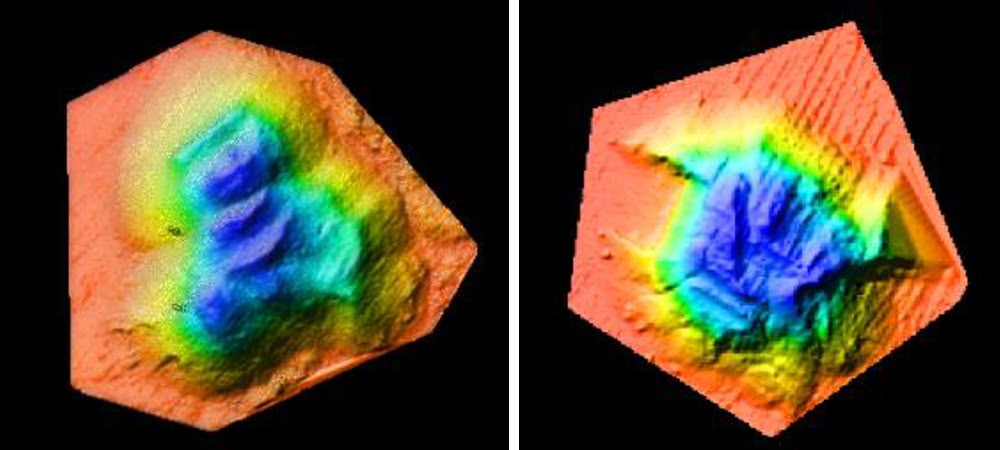
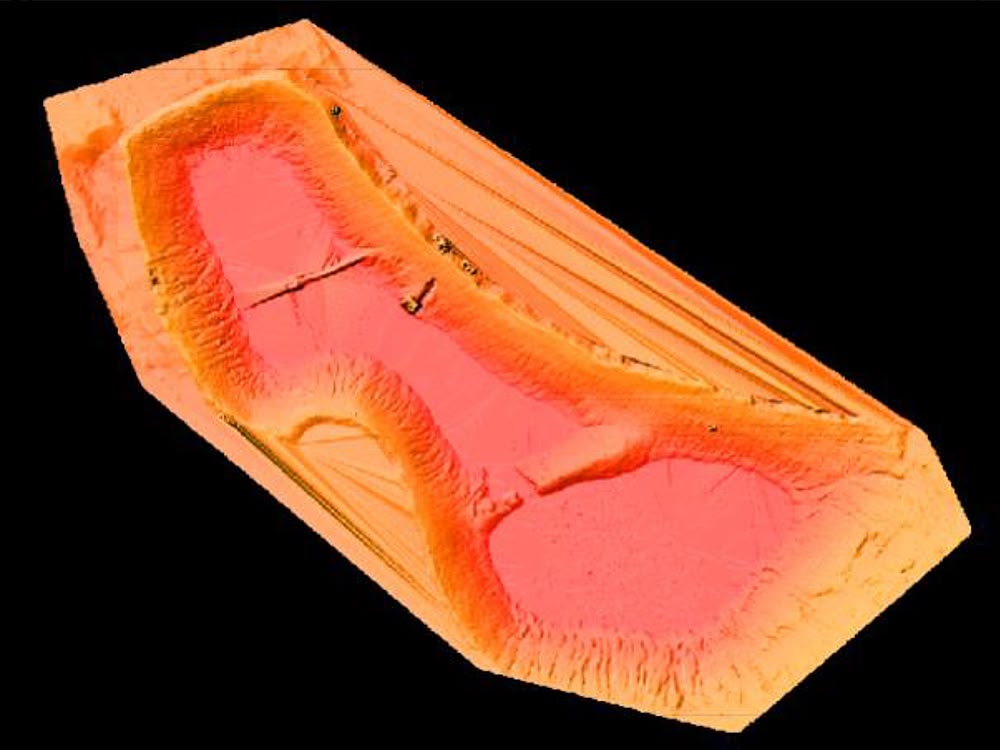
As a result, measurements were taken of the volumes of pits and piles at the construction site:
- Pile 1 Volume = 60.7 m3
- Pile 2 Volume = 27.4 m3
- Pits Volume = 307 m3
How LiDAR solved key challenges
- Automated calculation of earthwork volumes Scanning embankments, pits, and trenches enabled the creation of digital elevation models (DTM/DSM) in minutes. Specialized software compares the resulting point clouds with the design 3D model and automatically calculates the precise volume of excavation and fill with an error of less than 1–2%.
- Daily monitoring of dynamics (4D control) Regular site surveys made it possible to overlay scans from different days. Engineers saw the actual progress of mass movement in real time, completely eliminating human error during work acceptance.
- Monitoring of as-built documentation and design elevations The laser beam records road surface elevations, slopes, and trench geometry before concrete is poured or asphalt is laid, immediately identifying deviations from the design and preventing costly rework.
Conclusion
The use of laser scanning (by the RESEPI EchoONE) at a site near Jackie Robinson Park has yielded significant financial and operational benefits:
| Indicator/Task | Before LiDAR implementation | After LiDAR implementation |
|---|---|---|
|
Surveying time for 1 hectare of site |
2–3 hours (manual measurements) |
< 10 minutes (UAV) |
|
Volume calculation precision |
Error up to 10–15% |
Error less than 1.5% |
|
Data update frequency |
Once a week / 2 weeks |
Daily (at the end of the shift) |
|
Report preparation time |
1–2 days |
10–15 minutes (auto-generation) |
The Jackie Robinson Ballpark survey demonstrates how the RESEPI EchoONE LiDAR system, coupled with a drone, can quickly create engineering-grade digital elevation and surface models in a single flight. LiDAR technology has proven itself as a standard for modern construction sites, paying for itself early in the project cycle by preventing material overruns, reducing equipment downtime, and eliminating rework.
The resulting DEM and DSM datasets go far beyond simple visualization, enabling detailed terrain profiling, elevation analysis, and GIS-based engineering workflows. With a point density exceeding 500 points/m2 and a vertical precision of <1 cm, the survey provides a robust digital foundation for infrastructure planning, asset management, future renovations, and long-term documentation of public recreational facilities.